Category Archives: visualization

I Want You To Want Me

Jonathan Harris and Sep Kamvar currently have a fascinating visualization up at NYC’s Museum of Modern Art called “I Want You To Want Me.” This beautiful video showcases the piece and its various movements. In short, they’ve taken profile content from online dating sites and used it to construct an image of humanity through their tastes, desires, self-descriptions, and ideas about the world. This is an interactive visualization on a touch-screen, allowing viewers to navigate through people’s self-expressions, all represented as bubbles with people trapped inside. The piece is currently on display at the MOMA and will be until May 12. If you get to check it out, tell me what it’s like to play with it since I’ll only get to see the video. (Silly dissertation.)

I love that Harris and Kamvar use dating material to reflect society. I think that such expressions of intimacy are perfect for getting at the diversity and commonality of humanity. This also makes me think of Golan Levin, Kamal Nigam, and Jonathan Feinberg’s The Dumpster which is an interactive visualization of the romantic breakups of American teenagers as seen through their blogs.

I’m in awe of all of these artists and their ability to create such engaging interactive visualizations of social data. Yummy tasty goodness.

Vizster on Numb3rs

On March 3, the CBS TV show Numb3rs used Vizster in a thought sequence about how social networks can be used to solve crimes. Vizster is the prefuse-driven network visualization tool that Jeff Heer and i crafted to look at Friendster data. Obviously, they are not using any real data, but instead using it as a backdrop that looks all snazzy and sophisticated (they even added sounds). Anyhow, it’s a trip. Take a look:

playful visualization

Yesterday, Martin Wattenberggave a talk at Berkeley about his work. I’ve heard him talk before but never about the Baby Name Wizard’s Name Voyager. After launching it, bloggers picked it up and spread it like a meme around the web. Martin decided to surf the thousands of blogs talking about it and found that people documented their exploration. In terms of user studies, this is *fantabulous*. All of a sudden, you have thousands of people testing the system in their own homes, for their own purposes and reporting on it in the process of sharing the toy. What is super cool is how people play with the system, collaboratively trying to find interesting data (think Googlewhacking). These are the kinds of things that you can never really test in a laboratory, but are the essence of people’s engagement with interesting systems.

People often talk about visualizations having no value, but it is times like this when i want to balk. What does it mean that people want to play with data? What does it mean to support play instead of pure information access? Of course, this is part of the argument that Jeff and i made in our Vizster paper for InfoVis. Martin just confirmed it and took it to the next level. Well, actually bloggers took it to the next level and made data visible to Martin.

The work-centered mentality of HCI kills me… it’s always about the task, about productivity, about goals. Whenever i balk at activity theory mentality and talk about play, people tell me that play is a productive task with goals. Gah! No it is not! Play is about exploration, curiosity, fun, alternate realities, culture, identity… What if we make visualization about play?

Recently, i’ve also become completely addicted to the Information Aesthetics blog – post after post of beautiful data visualization. I realize that i want to play with those systems, even when i don’t care about the data.

And what about when we learn to play through visualization? Martin talked about Thinking Machine 4 which visualizes how the computer is thinking about chess. I actually don’t know how to play chess but i sat and played with that applet for quite some time before i realized i should be doing other things. Could that system teach me strategy, teach me to play by letting me see the game from a different dimension?

::sigh:: Whenever i see Martin’s work or the work of Fernanda Viegas, i long to be making visualizations again. There’s nothing more magical than watching data take flight and they make it look so elegant and beautiful. If only it didn’t involve programming…

visualizing news bias

Buzztracker is a visualization of the locations of Google News stories, letting you quickly see how litle of the world is actually covered by the news. This visualization complements Ethan Zuckerman’s arguments about news coverage. What we need now are two maps – what the news covers and what the blogosphere covers. As much as Ethan’s stats are useful, there’s nothing like a map to let you viscerally get it.

Update:

Ethan has maps!! Check out:

The more red a country is, the more attention it’s getting from the media source. The more blue, the less it’s getting. The first map is of Google News over the past 14 days, the second is of blogs, surveyed by Blogpulse, over the last 90 days…

He has tons of these on his site.

Jonathan Harris

I went to a great talk today by Jonathan Harris. He demoed various aspects of his artist work, most notably the visual news reader 10×10, wordcount (a tool that would make George Carlin proud) and Understanding Vorn – a fantastic visual entrance to LiveJournal (which also reminds me of why i love Quizilla). All of these pieces connect language to images and create a really compelling mechanism for accessing information in novel ways. Fantastic interactive art, absolutely fantastic.

It sends shivers down my spine to see someone who knows how to construct visual images in a compelling manner. Damn i love that shit. Harris also made me very happy by referencing a friend of mine from Media Lab days – Golan Levin (another brilliant visual artist).

Visualizing FOAF

For all of you FOAF fiends out there, check out Paolillo & Wright’s chapter on “Social Network Analysis on the Semantic Web: Techniques and Challenges for Visualizing FOAF”. I have a feeling that it might be of great value since it deals with how people are using FOAF and how you back away from it to see what dynamics are occurring. [I still hold my reservations about FOAF even though i really like this paper.]

visualizing the internet

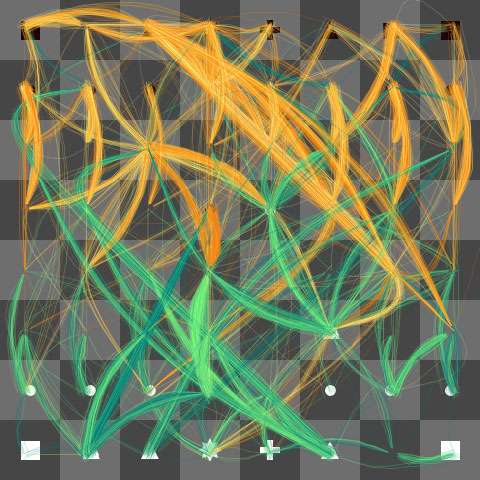
Check out the Opte Project:

This project was created to make a visual representation of a space that is very much one-dimensional, a metaphysical universe. The data represented and collected here serves a multitude of purposes: Modeling the Internet, analyzing wasted IP space, IP space distribution, detecting the result of natural disasters, weather, war, and esthetics/art. This project is free and represents a lot of donated time, please enjoy.

storytelling paper finished!

Fernanda and i have been working our tooshies off to finish a paper that we wanted to submit to HICSS-37. We’ve been trying to articulate how our visualizations are actually useful as digital artifacts for remembering and storytelling. They provide snapshots of one’s digital presence, but they are coarse enough to allow you to construct your identity in the sharing, presenting on what you see fit to present. Much fun. Anyhow, a draft version is available for the curious.